
📉 Decision Tree: What To Do When a Stock Price Falls Sharply
- Max Teh

- Apr 3
- 3 min read
Table of contents
Disclaimer: This communication is provided for information purposes only and is not intended as a recommendation or a solicitation to buy, sell or hold any investment product. Readers are solely responsible for their own investment decisions.
Why This Framework Matters
When markets are volatile and filled with uncertainty, it is common to see large price swings within a short period of time.
In such situations, it becomes important to:
Identify any potential red flags early
Make timely decisions for downside protection
Or capitalize on buying opportunities when there is a disconnect between price and fundamentals
This decision tree provides a structured way to assess the cause of a price drop, and determine the appropriate course of action.
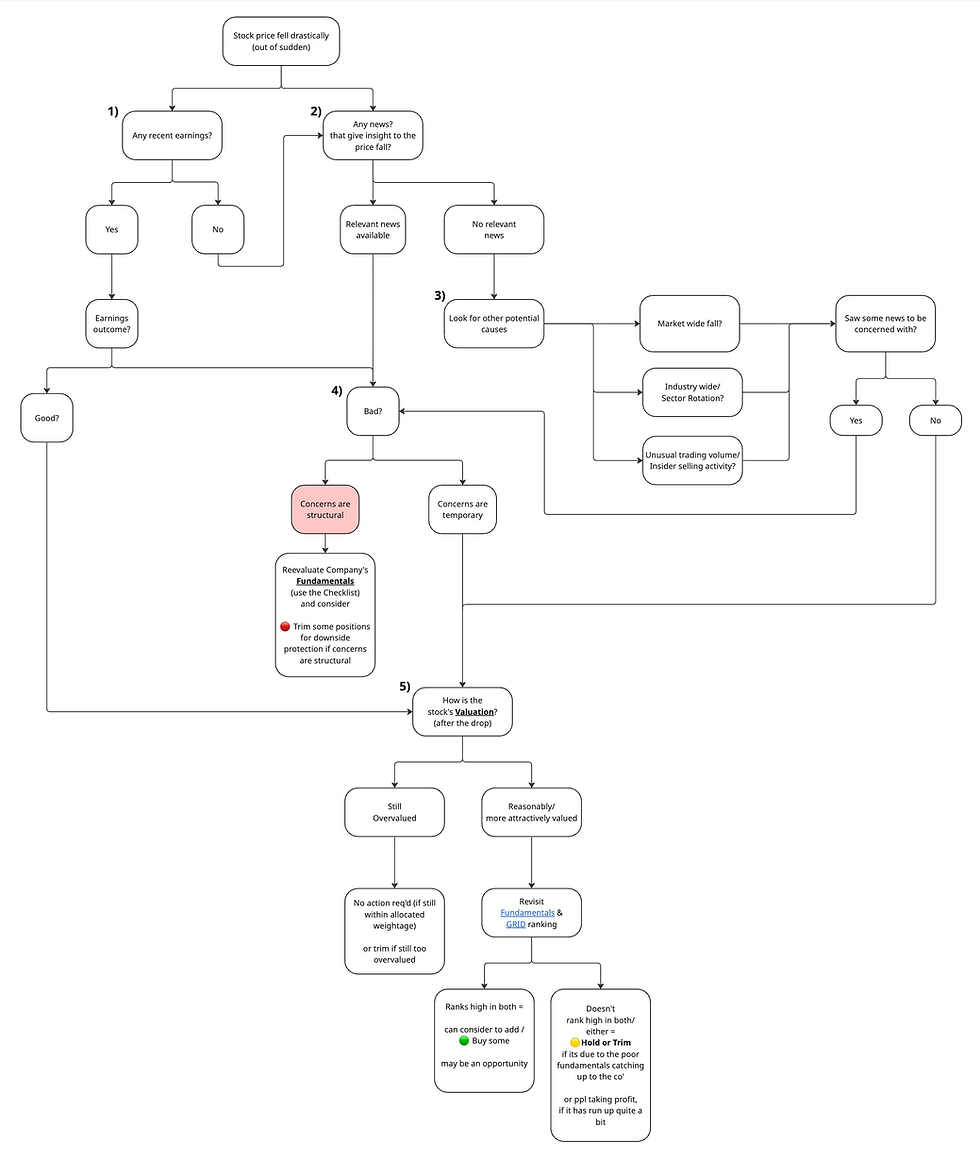
Step 1: Check for Recent Earnings
Start by checking if the price movement is driven by earnings.
If there are recent results:
Download the relevant materials:
Earnings release
Investor presentation
10-Q / filings
Earnings transcript
You can use AI tools such as NotebookLM to speed up the analysis.
Example prompt:
The stock price fell -7% after earnings results.
List the most probable factors that caused the movement.
Include:
i) Likelihood score (1–10)
ii) Level of concern (1–10, where 10 = structural concern)
Rank by likelihood and provide an overall concern score.
This helps to quickly identify the main drivers behind the earnings reaction.
Step 2: Check for Relevant News
If there are no earnings, check if there is any news that provides insight into the price movement.
This includes:
Company announcements
Developments affecting the business
If relevant news is found, assess: Are the concerns structural or temporary? (Step 4)
Step 3: Check External Factors
If the price drop is not explained by earnings or company-specific news,
look for broader or external causes.
3.1 Market / Sector movements
Check if the decline is driven by:
Market-wide selloff
Industry or sector rotation
Useful tools:
Fiscal.ai → Compare peers using “Daily % Change” under "Industry Tab"

Finviz Heatmap → Useful for US stocks

TradingView Heatmap → Useful for international markets (example: Heat Map for HangSeng Index)
This helps determine whether the move is company-specific or market-driven.
3.2 Insider selling activity
You can also check if there has been any unusual insider selling activity, which may contribute to price weakness.
Steps:
Go to: Fintel.io → Insiders → Transaction History
Search for the company
Review recent insider transactions
Pay attention to:
Large or consistent selling by founders / C-level executives
Multiple insiders selling within a short period
Selling that does not appear to be routine
If such patterns are observed, it may indicate potential concerns that require further review.
If any concerns are identified → proceed to Step 4.
Step 4: Assess If Concerns Are Structural or Temporary
Once a potential cause is identified, determine the nature of the issue.
i) If concerns are structural:
Re-evaluate the company’s fundamentals using your checklist
Identify areas of weakness
Consider trimming positions for downside protection
ii) If concerns are temporary:
Proceed to Step 5 to assess valuation
Step 5: Assess Valuation (After the Drop)
After understanding the cause, evaluate how the drop has impacted valuation.
If the stock is still overvalued:
No action required (if within allocation)
Or trim if necessary
If Valuation is now more attractive:
Revisit Fundamentals & GRID ranking
If the stock ranks highly:
Can consider adding / buying
May represent an opportunity
If the stock does not rank highly:
Hold or trim
Could be due to:
Fundamentals weakening
Or prior overvaluation correcting
If the Cause Is Still Unclear
If none of the above explains the movement, you can use tools like Google AI mode to check for the most recent developments.
Example prompt:
Why did [Stock] fall X% yesterday/ just now?
Attribute causes to:
i) Market-wideSector/industry
ii) Valuation correction
iii) Fundamental concerns

Rate each (1–10) based on likelihood.
Conclusion
A sharp price decline should be analysed in a structured manner rather than in isolation.
By following this decision tree:
Start with earnings and news
Check for external and market-driven factors
Assess whether concerns are structural or temporary
Re-evaluate fundamentals and valuation
This allows for a more consistent approach when deciding whether to:
Reduce exposure
Maintain positions
Or take advantage of potential opportunities
Decision Tree when a stock falls sharply
Decision Tree when a stock falls sharply


Comments